Here's a question that keeps retail managers up at night: Why do 85% of people who walk into your store leave without buying anything?
That's not a typo. The average retail conversion rate hovers between 15-25%, meaning the vast majority of your foot traffic—people who made the effort to physically enter your store—walk out empty-handed. Every one of those non-converting visitors represents marketing money spent, staff time invested, and revenue left on the table.
But here's what's even more concerning: most retailers have no idea why these customers don't buy. They don't know which zones customers avoid. They don't know how long people spend in each section. They don't know if their staffing matches actual customer flow. They're essentially running their stores blind.
This is where people analytics changes everything. By using AI-powered cameras to track foot traffic, dwell time, movement patterns, and zone engagement, retailers are finally able to answer the questions that directly impact their bottom line—and the results are remarkable.
The Retail Blind Spot: What You Don't Know Is Hurting You
Traditional retail operates on intuition and incomplete data. Store managers rely on sales figures, gut feelings, and anecdotal observations. But sales data only tells you what happened at the register—it tells you nothing about what happened before that point.
Consider these questions most retailers cannot answer:
- How many people actually entered our store today? (Not transactions—actual visitors)
- What percentage of visitors reached our promotional display in the back?
- How long do customers spend in each department before abandoning?
- Are we over-staffed at 10am and under-staffed at 3pm?
- Which store entrance drives more purchasing behavior?
- Do customers from the mall entrance behave differently than street entrance visitors?
Without this data, every decision about store layout, staffing, promotions, and merchandising is essentially a guess. Sometimes you guess right. Often, you don't.
Revenue isn't just about traffic. It's about traffic × conversion × average transaction value. Most retailers obsess over driving more traffic (expensive) while ignoring conversion optimization (often free). A 5% improvement in conversion rate can equal 10-15% revenue growth with zero additional marketing spend.
The 5 Metrics That Actually Matter
People analytics generates enormous amounts of data. The key is focusing on metrics that drive actionable decisions. Here are the five that matter most:
Foot Traffic Count
Total visitors entering your store. The foundation for calculating conversion rate and understanding true store performance.
Conversion Rate
Percentage of visitors who make a purchase. The single most important metric for retail performance.
Dwell Time
How long customers spend in specific zones. Longer dwell often correlates with higher purchase intent.
Zone Engagement
Which areas attract customers and which are "dead zones." Critical for layout optimization.
Traffic Patterns
Hourly, daily, and seasonal variations. Essential for staffing optimization and promotional timing.
Customer Journey
The path customers take through your store. Reveals natural flow and friction points.
How AI-Powered People Analytics Works
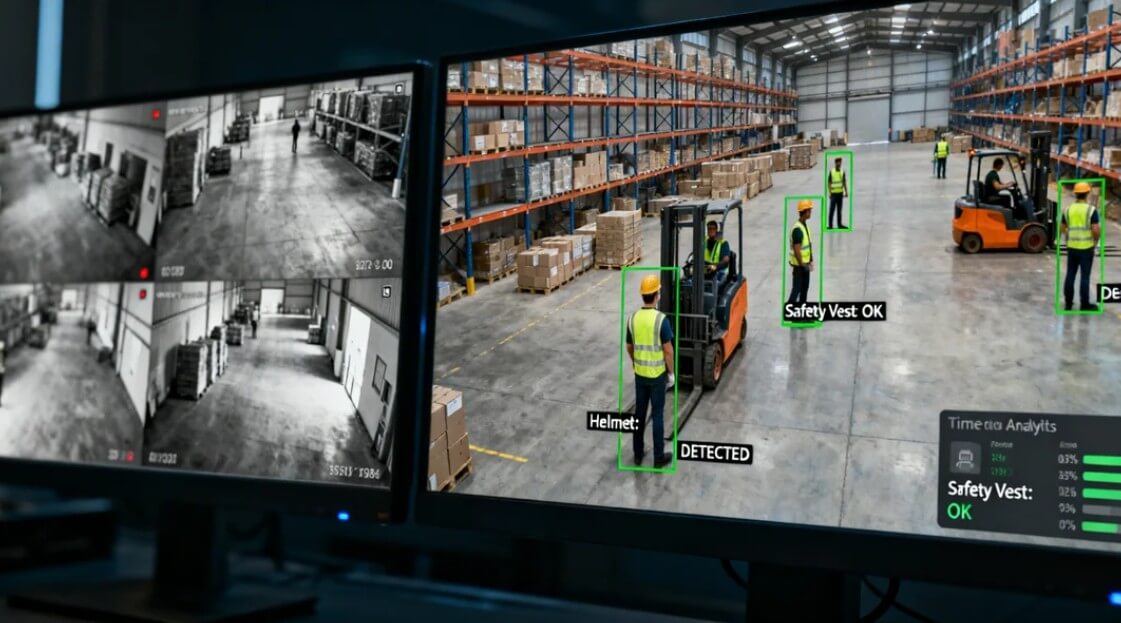
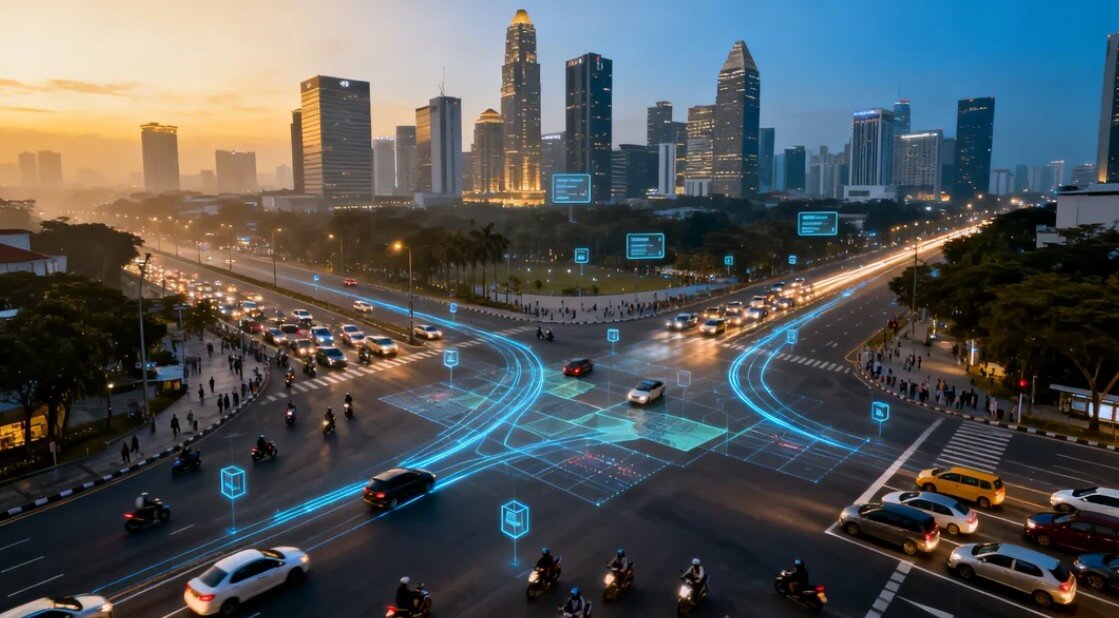
Modern people analytics systems use computer vision—the same AI technology that powers facial recognition and autonomous vehicles—to understand human presence and movement. Here's the process:
1. Video Stream Analysis
The system connects to your existing CCTV cameras (or dedicated sensors) positioned at entrances, exits, and key zones throughout the store. Unlike traditional beam sensors that simply count interruptions, AI actually "sees" and understands the scene.
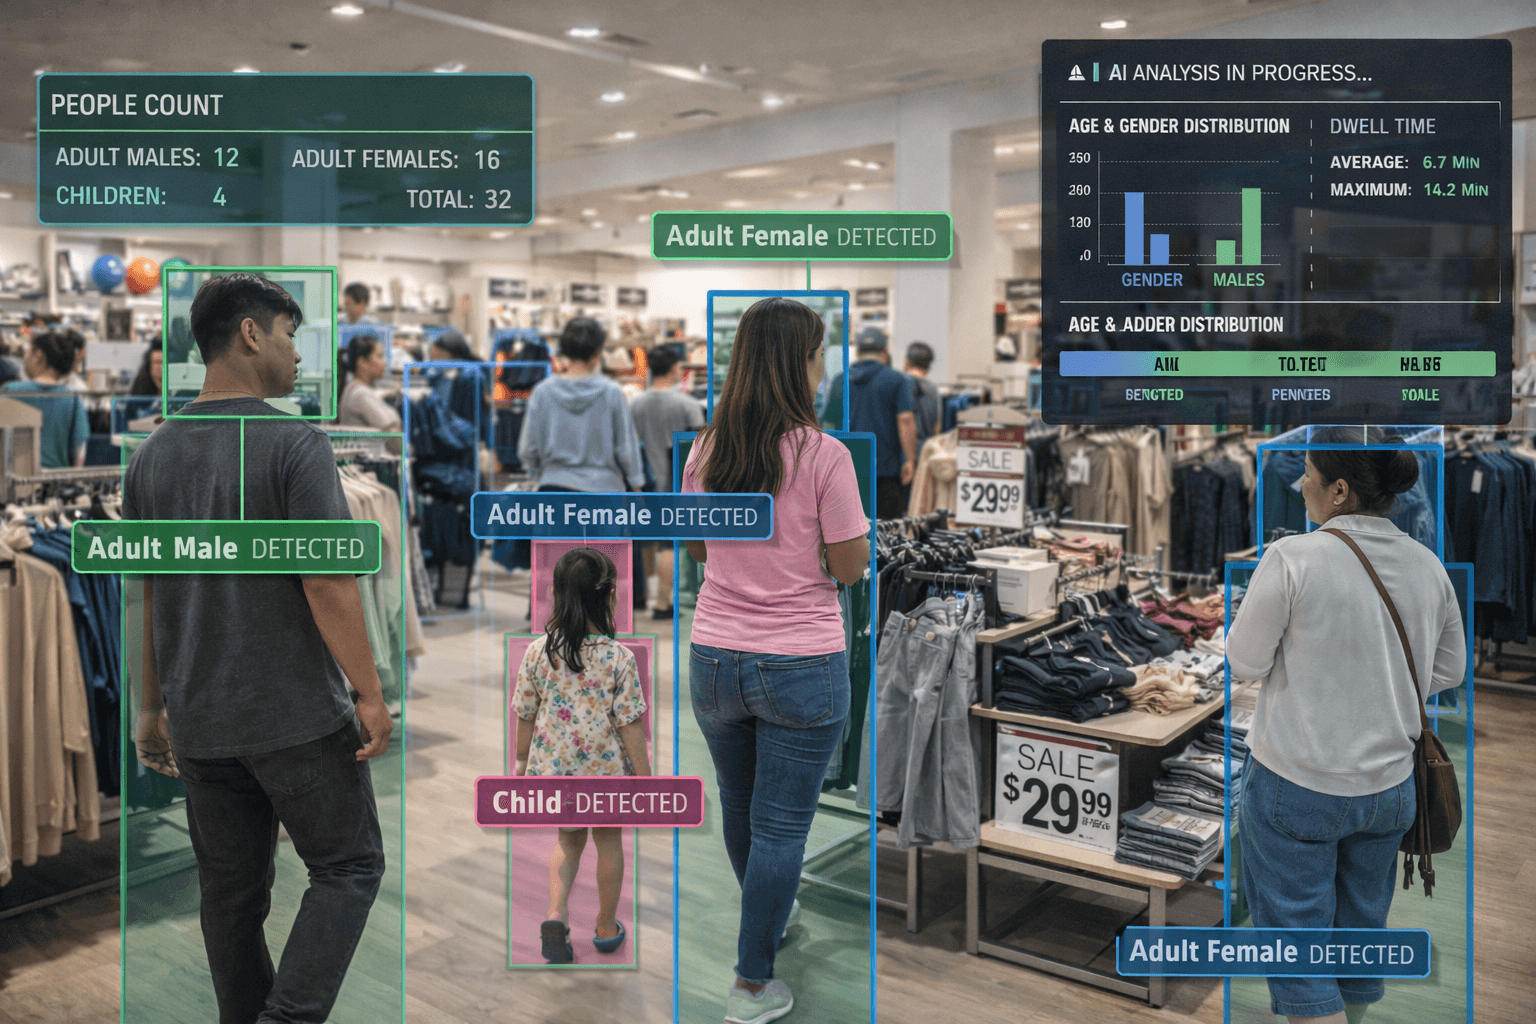
2. Person Detection & Tracking
AI identifies each individual person in the frame and tracks their movement across the store. It can distinguish between staff (who may wear uniforms) and customers, between adults and children, and even differentiate between groups traveling together.
3. Behavior Analysis
The system analyzes movement patterns: Where do people go? How long do they stay? What path do they take? Where do they stop? This data is aggregated and anonymized—no facial recognition or personal identification is stored.
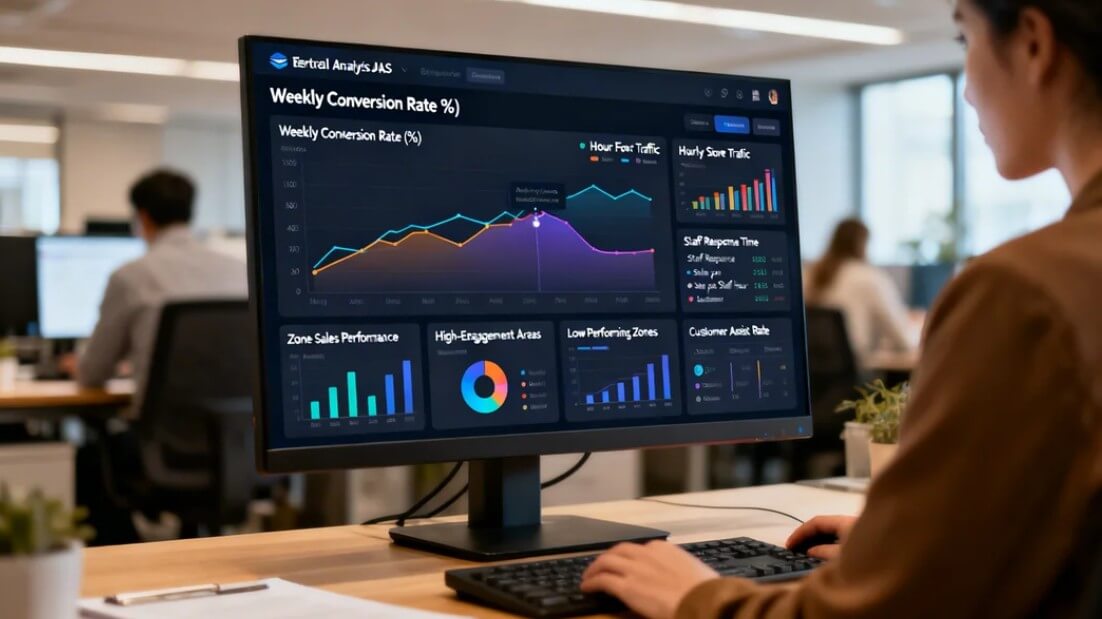
4. Actionable Insights
Raw data is transformed into dashboards showing traffic trends, heatmaps of customer density, conversion funnels, and anomaly alerts (unusual traffic drops, queue buildups, etc.).
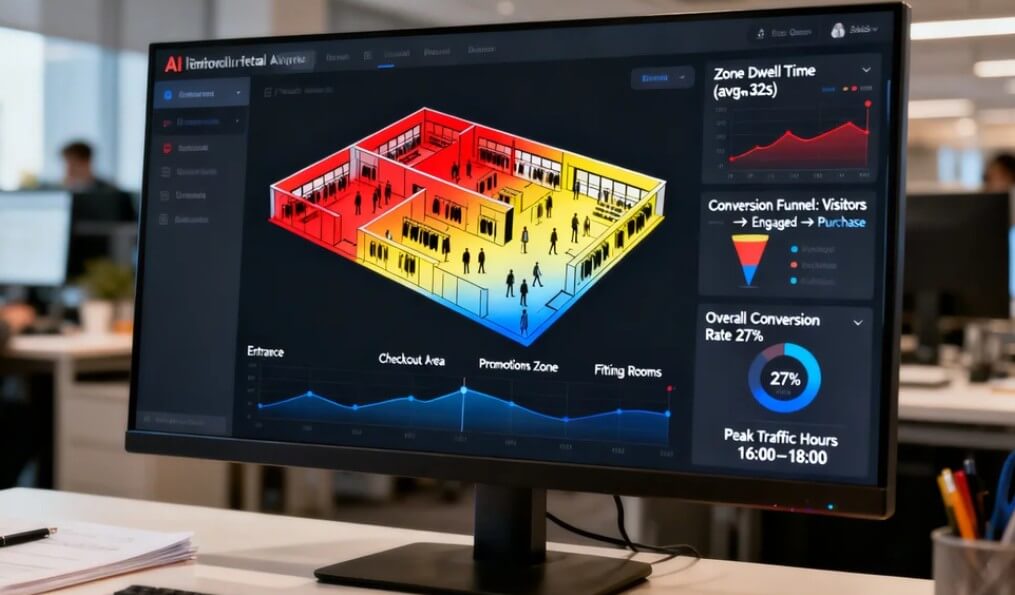
AI-powered analytics achieves 95-98% counting accuracy versus 70-85% for traditional infrared sensors. More importantly, AI provides context—it knows the difference between an entering customer, an exiting customer, and a delivery person walking through.
7 Data-Driven Strategies to Boost Conversion
Data without action is just expensive trivia. Here are seven proven strategies that retailers use to transform people analytics insights into measurable results:
Optimize Staffing to Match Traffic Patterns
Most retailers staff based on historical sales patterns. But sales lag traffic—by the time you're busy at the register, you've already lost potential customers who couldn't find help. People analytics reveals actual traffic patterns by hour, allowing you to position staff before the rush, not during it.
Action: Analyze your hourly traffic data for the past 4 weeks. Identify peak traffic times (not peak sales times). Adjust staff schedules so you have maximum floor coverage 30 minutes before peak traffic begins.
Eliminate Dead Zones with Strategic Merchandising
Every store has "dead zones"—areas that receive little foot traffic despite having products. Heatmap analysis instantly reveals these underperforming areas. The fix might be as simple as repositioning a display, adding lighting, or creating a visual pathway that draws customers in.
Action: Identify your lowest-traffic zone. Test placing a high-demand or promotional item there. Measure whether traffic to that zone increases over 2 weeks.
Optimize Checkout Queues to Prevent Abandonment
Long queues kill conversion. Studies show customers start abandoning purchases after 2-3 minutes of visible waiting. People analytics can alert managers in real-time when queue length exceeds thresholds, allowing intervention before customers give up.
Action: Set up queue monitoring with alerts when more than 3 people are waiting. Track abandonment rate (people who join then leave the queue). Test opening additional registers when queue threshold is hit.
A/B Test Store Layouts with Real Data
Should the new collection go in front or back? Does the promotional endcap work better on the left or right? Instead of guessing, use people analytics to run controlled tests. Measure traffic, dwell time, and conversion for each configuration.
Action: Choose one layout change to test. Run configuration A for one week, configuration B for the next. Compare zone traffic, dwell time, and conversion rate. Implement the winner permanently.
Identify High-Value Customer Behaviors
Some customers browse quickly and buy. Others linger extensively and leave empty-handed. By correlating dwell time and zone visits with actual purchases (via POS integration), you can identify behavioral patterns that predict conversion—then design experiences that encourage those behaviors.
Action: Analyze which zones have the highest correlation between dwell time and purchase. Ensure those zones have optimal staffing, lighting, and product availability.
Measure Marketing Campaign Effectiveness
Did that Instagram campaign actually drive store traffic? Without foot traffic data, you only know if sales increased—but sales can increase for many reasons. People analytics lets you measure the direct traffic impact of specific marketing initiatives.
Action: Before launching a campaign, establish your baseline traffic. Measure traffic during and after the campaign. Calculate traffic lift and compare against campaign cost to determine true ROI.
Benchmark Performance Across Locations
For multi-store retailers, people analytics enables true apples-to-apples comparison. A store with lower sales might actually have a higher conversion rate—it just gets less traffic. Understanding this distinction changes how you allocate resources and evaluate managers.
Action: Calculate conversion rate (not just sales) for each location. Identify your highest-converting store. Document what they do differently. Apply those practices to lower-converting locations.
Case Study: Fashion Retailer Increases Conversion 23%
A mid-sized fashion retailer with 12 stores across Java implemented people analytics to understand why some locations consistently outperformed others despite similar traffic levels.
The Challenge
Store #7 and Store #3 had nearly identical foot traffic (approximately 800 visitors/day) but Store #7's sales were 35% lower. Management assumed the issue was the location's demographics, but had no data to support or refute this theory.
What the Data Revealed
After implementing people analytics, several insights emerged:
- Traffic timing mismatch: Store #7's peak traffic was 2-4pm, but full staffing was scheduled for 11am-1pm (following a traditional lunch rush model that didn't apply to this mall location)
- Fitting room bottleneck: Dwell time in the fitting room area was 40% longer than Store #3, but not because customers were trying more items—they were waiting for available rooms
- Dead zone issue: The men's section, positioned in the back corner, received only 12% of store traffic despite representing 30% of inventory investment
- Queue abandonment: During peak hours, 18% of customers who picked up items never completed purchase—heatmap showed them leaving the queue area
Actions Taken
- Shifted staff schedules to match actual traffic patterns (+2 staff during 2-4pm, -1 during slow morning)
- Opened temporary fitting room station during peak hours using a corner of the stockroom
- Moved men's bestsellers to a mid-store display with clear sightlines from entrance
- Implemented queue alert system—manager opens second register when 3+ customers waiting
Results After 3 Months
"We thought we knew our store. The data showed us we were making decisions based on assumptions that were simply wrong. The ROI was obvious within the first month—we've now rolled out analytics to all 12 locations."
Getting Started: Implementation Guide
Implementing people analytics doesn't require ripping out your existing infrastructure. Here's a practical roadmap:
Phase 1: Assessment & Planning (Week 1)
- Camera audit: Evaluate existing CCTV coverage. Entrances and exits are essential; zone monitoring is valuable but can be phased in.
- Define objectives: What questions do you most need answered? Prioritize metrics that align with your biggest business challenges.
- Establish baselines: Document current conversion rate (if known), sales patterns, and staffing schedules.
Phase 2: System Setup (Week 2-3)
- Camera integration: Connect cameras to the analytics platform via RTSP streams.
- Zone configuration: Define counting lines (entrances/exits) and zones of interest (fitting rooms, checkout, key departments).
- POS integration: Connect transaction data to enable conversion rate calculation.
- Dashboard setup: Configure reports and real-time alerts relevant to your objectives.
Phase 3: Learning & Optimization (Week 4+)
- Collect baseline data: Run the system for 2-3 weeks without making changes. Understand your patterns.
- Identify opportunities: Look for obvious wins—staffing mismatches, dead zones, queue issues.
- Test and measure: Implement one change at a time. Measure impact. Scale what works.
- Iterate: People analytics is ongoing. Consumer behavior evolves; your optimization should too.
Frequently Asked Questions
Foot traffic is the total number of people entering your store. Conversion rate is the percentage of those visitors who make a purchase. For example, if 1,000 people enter and 150 buy something, your conversion rate is 15%. Both metrics are essential—high traffic with low conversion indicates missed opportunities.
Modern AI-powered people counters achieve 95-98% accuracy, significantly higher than traditional infrared sensors (70-85%). AI can distinguish between adults and children, staff and customers, and even track direction of movement—capabilities impossible with basic sensors.
Average retail conversion rates vary by industry: Fashion retail typically sees 20-40%, electronics 10-20%, grocery 50-70%, and luxury goods 5-15%. However, the goal should be improving YOUR conversion rate, not matching industry averages. Even a 2-3% improvement can significantly impact revenue.
Most retailers see actionable insights within 2-4 weeks of implementation. However, meaningful conversion improvements typically emerge after 2-3 months of data-driven optimization. The key is consistently acting on the data, not just collecting it.
Yes, most AI-powered analytics solutions can connect to existing CCTV infrastructure via RTSP streams. You don't need specialized sensors or new cameras. However, camera placement affects accuracy—entrance/exit points and key zones should have clear, unobstructed views.
Stop Guessing, Start Growing
Retail has always been a game of small margins and fierce competition. The difference between thriving and struggling often comes down to conversion rate—and conversion rate comes down to understanding your customers.
People analytics removes the guesswork. It transforms your existing cameras into a continuous stream of actionable intelligence about how customers actually behave in your space. Every layout decision, staffing choice, and promotional placement can be measured, tested, and optimized.
The retailers who embrace this technology aren't just tracking metrics—they're building a competitive advantage that compounds over time. Every insight leads to an improvement. Every improvement leads to better results. And the gap between data-driven retailers and those still running on intuition only widens.
The question isn't whether people analytics works. The question is how much longer you can afford to operate without it.
Ready to Unlock Your Store's Hidden Potential?
See how Oventa's people analytics can reveal the insights you need to increase conversion and grow revenue.
Get a Free Store Assessment